
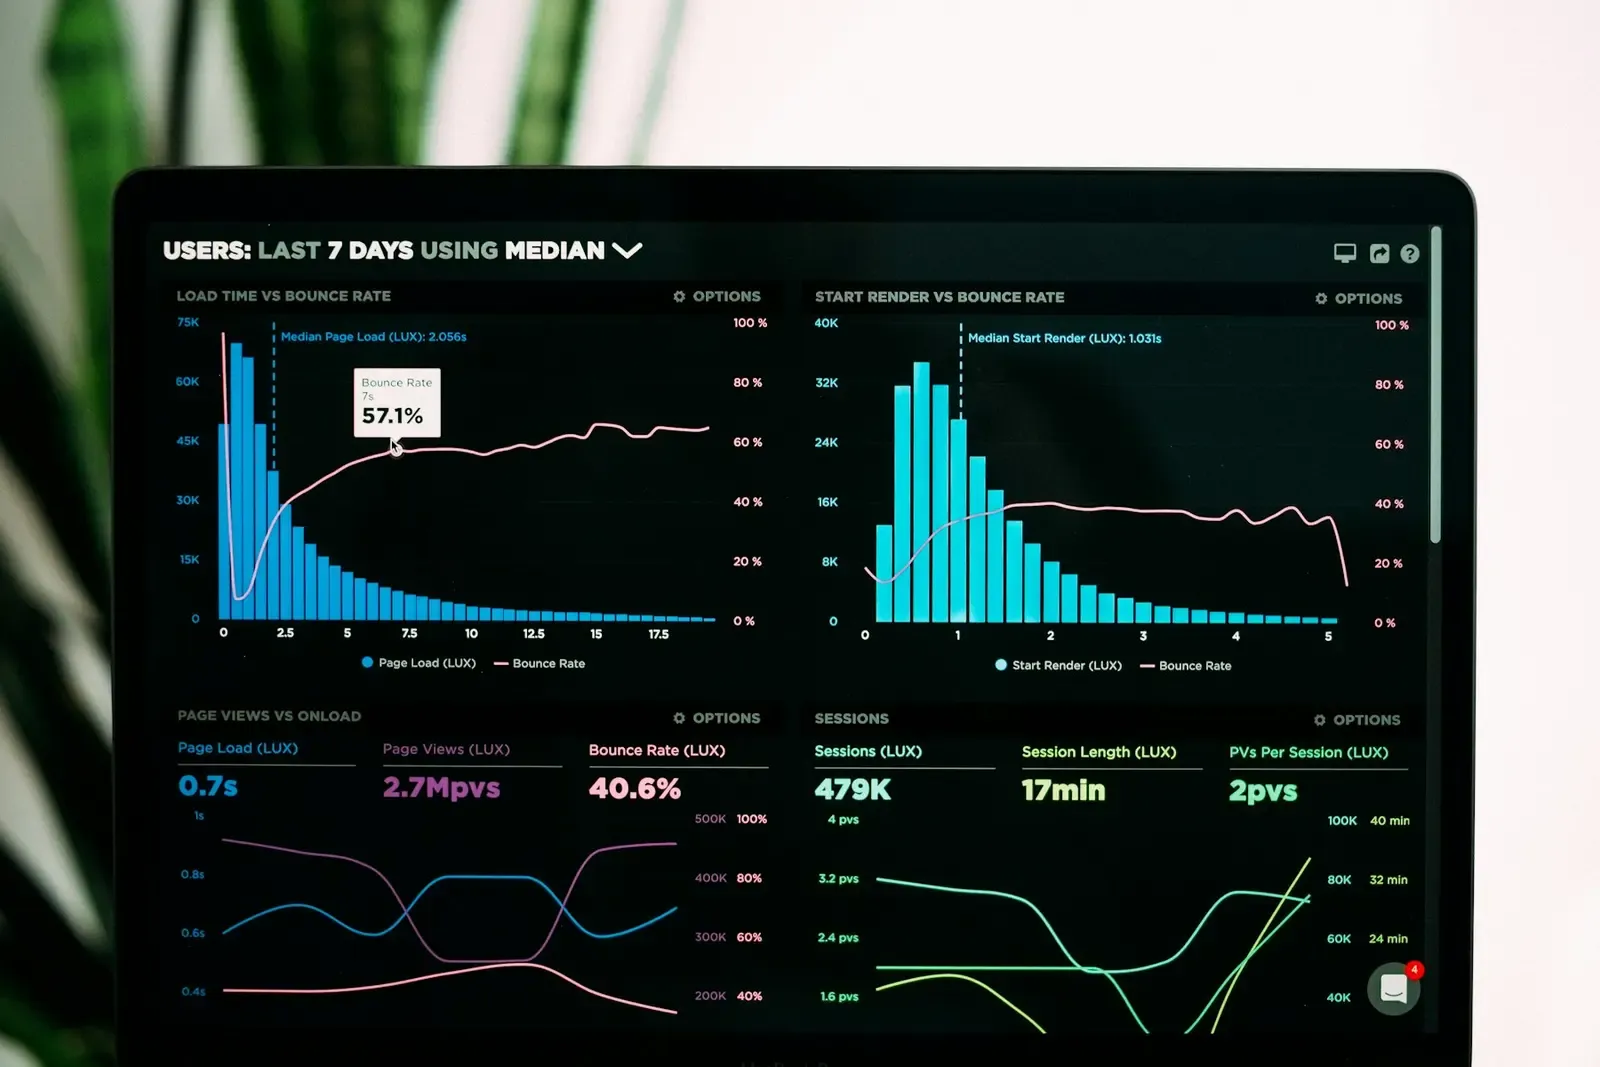
Before I designed dashboards, I was the person staring at them at 6 a.m., trying to work out why yesterday’s orders still hadn’t shipped. Most dashboard UX advice is written from the designer’s desk. This is what it looks like from the warehouse floor.
- In operations first
- 7 yrs
- Dashboards I design now
- 2
- Question per widget
- 1
01 · The real user
Nobody opens a dashboard just to look at it
In seven years of operations, I never once opened our reporting tool out of curiosity. I opened it because something had gone wrong, or because my manager was about to ask me something and I wanted the answer first.
That’s the real job of a dashboard. It answers a question someone already has. So before I draw a single chart now, I write down the questions people ask most often, in their own words. For a shift supervisor it’s usually three: are we on track, what’s stuck, and who needs help? If a widget doesn’t help answer one of those, it doesn’t make the cut.
02 · Design for a glance
You have about three seconds
Most of my old team checked screens while holding something: a scanner, a box, a clipboard. One free hand and a few seconds. A beautiful chart you have to hover over to read is useless to them. Here’s what works instead:
- One number per question, big enough to read from arm’s length.
- Status in words and icons, not colour alone. Around 1 in 12 men has some form of colour blindness, and warehouse floors aren’t short of men.
- Exceptions at the top. The normal stuff can wait. Problems shouldn’t need a scroll.
- A timestamp on everything. “Updated 2 min ago” builds more trust than any amount of visual polish.

03 · Density isn’t the enemy
Don’t be scared of a busy screen
There’s a habit in UX of stripping everything back: lots of white space, three cards, one chart. That’s fine for a consumer app. It doesn’t work for someone who reconciles dozens of SKUs before lunch.
Experienced operators want density. They’ve learned where to look. What they hate isn’t a busy screen, it’s an inconsistent one. Totals that sit somewhere different on every page. Filters that reset. Columns that move around. Keep the layout predictable and you can show far more than you’d think. The trick is to design for each person’s level of zoom:
| Who’s looking | What they need | What I design |
|---|---|---|
| Floor associate | Their next task | One list, big tap targets |
| Shift supervisor | What’s stuck right now | Status counts and a “stuck” queue |
| Ops manager | How this week is trending | Charts compared with last week |
| Leadership | One honest number | A summary that links to detail |
- Floor associate
- Their next task
- → One list, big tap targets
- Shift supervisor
- What’s stuck right now
- → Status counts and a “stuck” queue
- Ops manager
- How this week is trending
- → Charts compared with last week
- Leadership
- One honest number
- → A summary that links to detail
04 · Numbers that lead somewhere
Every number should be clickable
The worst feeling in operations is seeing a red number and having nowhere to go with it. If the screen says 14 orders are delayed, I want to tap that 14 and see which ones, why, and who’s on it. One step. Not a trip to another tool and an export to Excel.
This is where most dashboards quietly fail. The data is there, but the action lives somewhere else. Putting the next step right beside the number is often the most useful thing a designer can do on a dashboard, and it’s rarely in the brief.
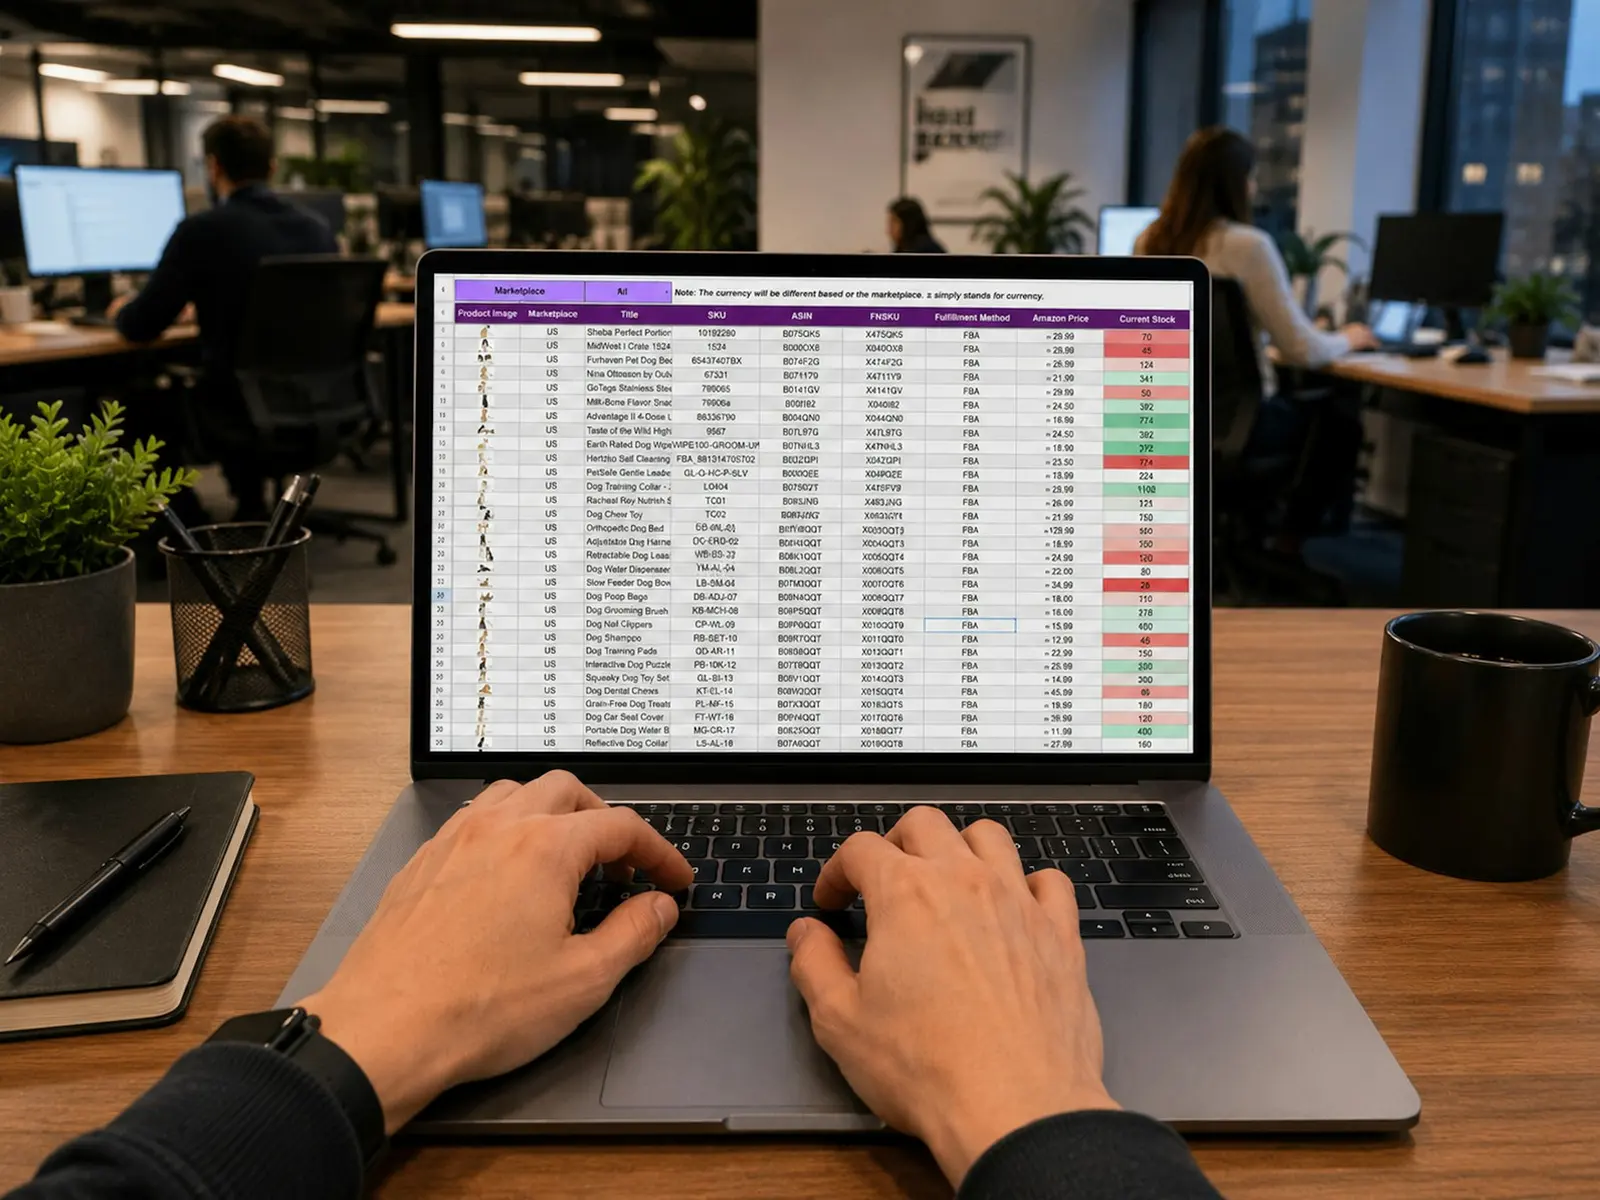
05 · Test it on the floor
Meeting rooms lie
Dashboards always look fine in a design review. Everyone’s sitting down, the screen is big and the sample data is clean. Real life has glare, small screens and data with gaps in it.
So I test where the work happens, on the actual device, with live data. I give someone a real question, like “Which orders won’t make today’s truck?”, and time how long it takes them to answer. If it takes more than a few seconds, the design isn’t done.

06 · FAQ
Questions people ask me about dashboard UX
What makes good dashboard UX?
A good dashboard answers the questions its users already have, at a glance. It puts exceptions first, uses words as well as colour for status, shows when the data was last updated, and lets people act on a number without leaving the screen.
How many metrics should a dashboard show?
There’s no magic number. Start with the three to five questions your users ask most often and give each one clear metric. Anything that doesn’t answer one of those questions belongs on a detail page, not the main view.
What’s the difference between an operational and an analytical dashboard?
An operational dashboard is about right now: what’s happening, what’s stuck and who needs help. An analytical dashboard is about trends over days or weeks. Mixing both on one screen is one of the most common reasons dashboards feel cluttered.